
In this article, we take a look at the various cost trends associated with weddings, both from the couples’ side and from the guests side. These statistics primarily reflect amounts spent in the United States.
Unfortunately, we do not have similar surveys in Canada, but hopefully you can extrapolate some of this information to make a more informed decision on how much you are willing to spend. We expect the numbers to be quite close given our proximity to the US and the similarities in our spending styles and wedding customs. As with all statistics, we should take this with a grain of salt as these are average numbers for the average bride, and the numbers skew immensely depending on the geographical region and the methodology in which these numbers are tallied.Given that these statistics are sampled from different sources, some of the numbers can be a little different, so please take them with a grain of salt.
The statistics mentioned here come from The Wedding Report, TheKnot.com, and Ebiequity.
The Wedding Report:
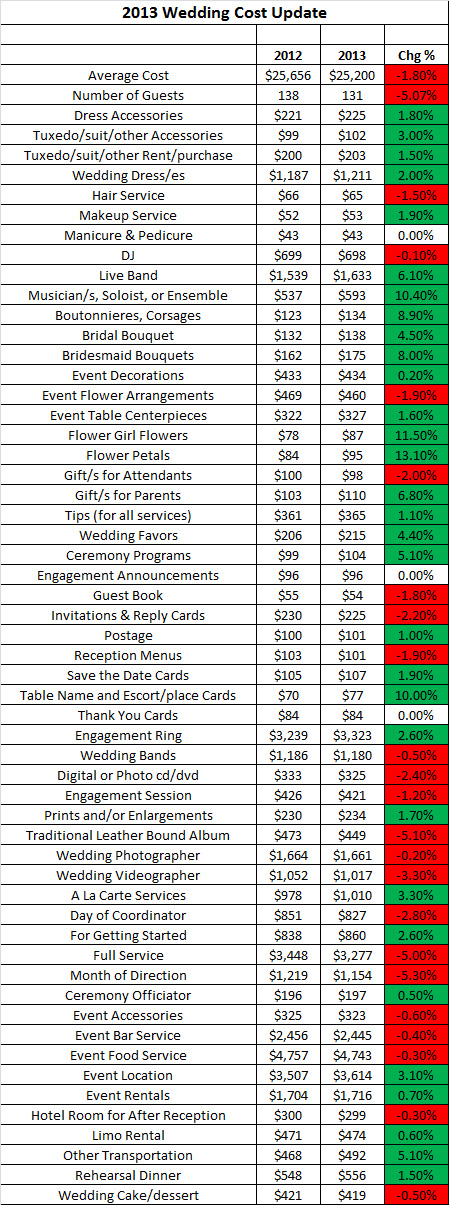
According to The Wedding Report Inc., which was produced in January 2014, the average budget in the US shrunk by 1.8% to $25,200. It believes this is related to guest counts slipping from 138 in 2012 to 131 in 2013 and couples spending less on services. The Wedding Report conducts annual surveys as well as aggregates data from various sources, including the CDC, Census Bureau, Department of Labor, Bureau of Economic Analysis (BEA), COLI, GeoLytics, Inc. and Easy Analytic Software, Inc., as part of the estimating and forecasting process. The sample number of people independently surveyed for the 2013 numbers is 3,700 and includes pre-wedding couples, post-wedding couples, and wedding businesses.
TheKnot.com:
In contrast, TheKnot.com, which published its findings in March 2014, shows quite different numbers for the average wedding budget – $29,858 and is actually up from 2012:
.jpg)
TheKnot.com surveyed 13,000 brides and grooms who got married between January 1 and December 31, 2013 who had a TheKnot.com or WeddingChannel.com membership.
So which one is more accurate? It’s actually quite hard to say. We took the most representative costs and pitted them side-by-side for comparison.
.jpg)
There are a few items which show similar results, such as Wedding Dress, Tuxedo, and Musicians. However, the bulk of the other costs are quite different. We believe this is likely due to the differences in the definition of the vendor cost. For example, for the Wedding Planner category TheKnot.com shows $1,874 for 2013 whereas The Wedding Report shows $3,277 for full planning. It seems as though TheKnot.com shows its wedding planner numbers based on a combination of full wedding, a la carte services, day of coordinator, for getting started, or month of direction, whereas The Wedding Report shows these numbers in separate categories. Similarly, photographers show $2,440 vs. $1,661. TheKnot.com does not segregate digital/photo cd/dvd, engagement session, prints and/or enlargements, or traditional leather bound albums whereas The Wedding Report does. Again, we urge you take these numbers with a grain of salt.
In addition to cost numbers, TheKnot.com also published some interesting wedding statistics over the past year:
- Most Expensive Place to Get Married: Manhattan, $86,916 average spend
- Least Expensive Place to Get Married: Idaho, $16,159 average spend
- Average Spent on a Wedding Dress: $1,281
- Average Marrying Age: Bride, 29; Groom, 31
- Average Number of Bridesmaids: 4 to 5
- Average Number of Groomsmen: 4 to 5
- Most Popular Month to Get Engaged: December (16%)
- Average Length of Engagement: 14 months
- Most Popular Month to Get Married: June and September (15% each)
- Popular Wedding Colors: Blue (35%), Purple (26%), Pink (25%), Metallics (25%)
- Percentage of Destination Weddings: 24%
So what did TheKnot.com see as wedding trends for 2013-2014 (excerpt from http://www.xogroupinc.com)?
GROWING BUDGETS. Couples are spending more on their weddings than ever. Following the trend of growing budgets for the past two years, wedding budgets are at an all-time high with the average wedding cost hitting $29,858, the highest level ever. Less couples (20%) say the economy affected their wedding budget – a statistic that has continually decreased year over year, since reaching an all-time high of 34% in 2009. Wedding standards also continue to rise, in fact, about 1 in 8 couples (14%) spent more than $40,000 on their nuptials, and nearly 1 in 4 (24%) didn’t even have a budget.
Now that we’ve looked at spending by couples for their wedding, what about what guests spend? In April 2014, American Express published a commissioned wedding survey report conducted by Ebiquity to determine guest spending trends at weddings. This was conducted online using a random sample of 1,503 adults from the general US population as well as an Affluent demographic (charts below courtesy of American Express).
.jpg) When giving a wedding gift, apparently consumers equally prefer to give from the couple’s registry as they do cash. But, most couples continue to prefer to receive cash:
When giving a wedding gift, apparently consumers equally prefer to give from the couple’s registry as they do cash. But, most couples continue to prefer to receive cash:.jpg) Finally, the Ebiquity survey tallied the top five wedding investments for couples planning their wedding:
Finally, the Ebiquity survey tallied the top five wedding investments for couples planning their wedding:.jpg) Looks like food is still the most important thing folks. But don’t forget the wedding planner! A good wedding planner can really help push those other costs down!
Looks like food is still the most important thing folks. But don’t forget the wedding planner! A good wedding planner can really help push those other costs down!
